

Why Your Startup Pitch Needs a Sensitivity Analysis
Your startup needs more than an all-star team, a product with a competitive advantage, and a sizable market to guarantee you success in fundraising for your venture. With thousands of proposals flooding investors' inboxes each year and an uncertain future for venture capital, it's crucial to distinguish your startup by demonstrating a deep understanding of the impact even small changes may have on the trajectory of your performance. Sensitivity analysis is the key to uncovering threats and opportunities and developing strategies to address them.
While founders want to project high optimism when pitching investors, ignoring challenges—or even just reality—can damage the trust you need to build with potential funders. VCs are quickly turned off by implausibly positive financial forecasts, such as overly generous market share predictions or unrealistic unit economics. Instead, they value the validity of model assumptions over exact revenue projections.
Establishing trust is critical in this process and is often built by effectively balancing risk and responsibility, showing that the consequences of every decision have been thoroughly evaluated.
Sensitivity analysis is a helpful way to calm investors’ nerves because it provides them with a view of the “margin of safety” associated with their investment. If an investor is using a minimum internal rate of return (IRR) as one of their investment qualification metrics, sensitivity analysis can easily demonstrate how significantly the forecasted performance would need to change before their investment falls below the minimum IRR.
What is Sensitivity Analysis?
Sensitivity analysis, also referred to as what-if analysis, measures the degree of change in a business model’s outputs based on deviations in associated key inputs, such as as market size, unit cost, price, or sales volume might affect financial performance.
From my experience, founders sometimes confuse sensitivity analysis and scenario analysis. While both practices evaluate the impact of changes on business models, they are not the same thing.
Sensitivity analysis typically focuses on the one or two most important variables in a business model—that is, the ones that typically cause the largest degree of change, depending on your industry and how your model is built. For example, you might want to sensitize sales price per square foot in a real estate development model, customer churn rates in a subscription-based model, or product mix in a manufacturing model.
Scenario analysis is used to measure business performance with variations in macro factors that influence the entire organization or an entire business unit. Some examples where scenario analysis would be appropriate would be to evaluate the impact of a recession or changing industry regulations—two situations that have a significant impact on the company’s performance even if some key variables and assumptions remain the same.
Small Changes in Assumptions, Big Changes in Value
When you’re valuing a startup company over long projection periods, say 5 or 10 years, small changes in the model’s underlying assumptions can cause large changes in the growth of cash flows and valuation. The example below shows how significantly small changes in assumed unit sales growth and revenue per sale can impact profitability and cash flows for a retail company.
In Table 1, the present value of future cash flows (including the terminal value) is just under $130 million.

Next, in Table 2, we examine the same forecast—except we’ve reduced the unit sales growth by 2% in the first year, and the revenue per sale by 1% in the first year. The present value of future cash flows (including the terminal value) has dropped significantly to $94 million, a 27.7% decrease.
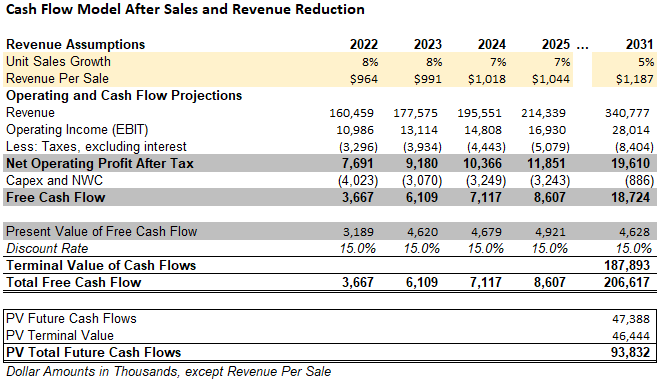
Again, that’s a 27.7% decrease in cash flows caused by a 2% drop in unit sales growth and a 1% drop in revenue per sale. And unit sales is not the only variable that can change. What if marketing expenses are higher? What if return rates are greater than expected? What happens if net working capital doesn’t improve as forecasted?
This is why startup companies need to assure investors they’ve stress tested their models and that they’ve developed risk management strategies for rainy days.
Sensitivity Analysis Reveals What's Most Important
Sensitivity analysis allows organizations with well-constructed business and financial models to pinpoint highly pivotal assumptions. Imagine being able to say, with confidence, you know which assumptions have the most significant impact on cash flow, and being able to quantify the change in cash flow for every percentage point change in the key assumption. That’s the power of sensitivity analysis.
Using our earlier retail company example, we can put this into practice. Starting with the assumptions in Table 1, the model forecasts 10% unit sales growth in Year 1. But how sensitive are cash flows to that assumption versus other assumptions? The following tables are examples of single variable sensitivity tables, which compare a single independent variable’s impact on a single dependent variable - present value of cash flows in this case. We can see from these tables how sensitive the present value of future cash flows is to changes in unit sales growth, wages paid per unit sold, and annual rent escalations.
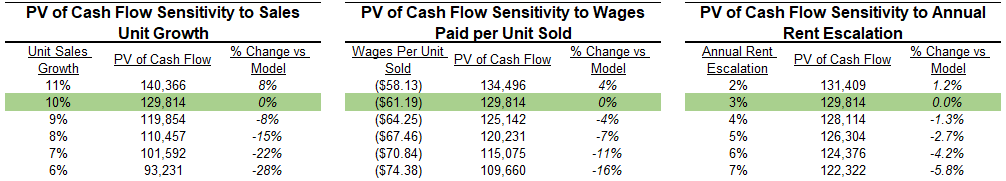
As we can see, unit sales growth is the most significant factor on cash flow of this trio, with a 1% change causing a roughly 8% change in the present value of cash flows. A 1% change in rent escalations only causes a 1.2% change, while a 5% change in wages paid per unit results in a 4% change in the present value of cash flows. With this information, you can zero in on the most important drivers of the business model—in this case, sales unit growth.
To take it a step further, we can evaluate the potential impact of two of these factors occurring with a multi-variable sensitivity table. In our current economic climate of high inflation, there is real risk that landlords will be requiring higher rents as leases expire. So, let’s say that we’re concerned about cash flow sensitivity to the compound effect of changes in both sales unit growth and rent escalations. Sticking with our retail example, we can construct the following table.

A look at this table tells us that a 1% increase in annual unit sales growth on the value of cash flows has about six times the impact that a 1% increase in annual rent escalations has. Doing this for all assumptions in the model will reveal how they interact. The light green highlights indicate the range of potential outcomes we expect with high confidence; anything outside this range is possible but unlikely. Investors can see we’re expecting the present value of cash flows to be worth anywhere between $118 million (lower right green corner) and $142 million (upper left green corner) given the range of potential outcomes. They can also see in the most extreme scenario of severely underperforming 6% revenue growth and 7% rent escalations the present value of cash flows are still $86 million.
Sensitivity Analysis Informs Strategy
Once you have sensitized your assumptions and identified the areas of greatest impact, you can develop strategies to monitor and optimize those parts of your business. In our example model, key drivers of unit sales growth would consist of customer acquisition costs (CAC), repeat customer rate, return rates, and cross-sell and up-sell rates.
Let’s say, after sensitizing the unit sales growth rates against these individual variables as we did with the rent escalation, you determine that return rates and CAC are the primary factors. Your team can then develop specific levels of performance that would be required to attain the forecasted unit sales growth targets. These performance metrics would become the key performance indicators (KPIs) that are monitored and managed by leadership.
From there, you can implement measurements of leading indicators to monitor daily that will inform management if the KPIs are expected to come in above or below the acceptable target. For example, a leading indicator for return rate may be customer satisfaction or net promoter score.
Sensitizing the activities that influence the business model’s KPIs allows you to develop a comprehensive sensitivity analysis. This provides the entire organization’s management team with the greatest chance of fully understanding the opportunities and threats present within the business model.
Sensitivity Analysis Can Set Your Pitch Apart
The number one reason startups fail is due to a lack of funding or cash flow problems. Not only that, with rising interest rates and an uncertain immediate economic future, startup funding declined significantly since 2021. This tells us two things; funding is critical for the success of your startup and the competition for funding is fierce.
If you’re looking to set yourself apart from the crowd in the eyes of investors, sensitivity analysis is a powerful tool. The ability to sensitize nearly all variables in a business model provides tremendous analytical flexibility and can illuminate potential opportunities and threats to the success of the business model.
By integrating this tool into your pitch and valuation projections, you can tackle potential investor concerns, validate your assumptions, and exhibit prudent risk management. In an era of heightened investor caution, such foresight and preparedness can set up your pitch—and your company—for success.
If you’re struggling to investor meetings or fundraising, our team will collaborate with you to develop a stellar pitch deck and financial model that gets you the meetings and funding your business requires. Get started today with a complimentary discovery session!